- Introduce blocks that prevent editing in selected areas, e.g. a country, an administrative unit (editing controversial objects in the field), and not the entire world. Now I can’t improve my neighborhood due to controversial editions in Ukraine.
- Comments on your profile should link to a page where your changeset comments are located, not to log comments.
- The link to your first edits in OpenStreetMap is intended to understand the difficulties for a beginner editor.
- Links to apps and websites related to OpenStreetMap from main page (with map) e.g.: MapRoulette, how did you contribute to OpenStreetMap?, osm-revert.
Users' Diaries
Recent diary entries
Posted by FFWHol_Norimaki on 13 May 2024 in German (Deutsch).
Last updated on 2 June 2024.
Sehr detaillierte Info / Anleitung (PDF) / Handbuchqualität (Grundlagen / viel weitere Ausbaustufe)
https://feuerwehr-grossmehring.de/cms/images/stories/Dokumente/openfiremap_anleitung.pdf
https://feuerwehr-grossmehring.de/cms/index.php/die-feuerwehr/hydrantenplaene
https://www.ff-steinheim.de/wp-content/uploads/FF_OSM_201901.pdf
http://loewa.feuerwehr-karlstetten.org/index.php?id=2
Definition der Feuerwehr spezifischen Punkte (von Feuerwehrhaus, über Hydrtant, bis Löschwasserbrunnen) auf OSM
https://wiki.openstreetmap.org/wiki/DE:OpenFireMap
Toollist
https://www.openstreetmap.org Offene Karten Daten (Basis)
https://www.osmhydrant.org/de Tool zum Aufnehmen von Hydranten
http://www.openfiremap.de/ Tool zur Hydranten Übersicht
https://print.get-map.org/maps/ Tool zum Ausdruck von Karten
http://overpass-turbo.eu/ Tool zur Datenverarbeitung (Datenwolken / Karten mit Zusatzinfos
Posted by FFWHol_Norimaki on 13 May 2024 in German (Deutsch).
Last updated on 2 June 2024.
Probleme bei Aufnehmen. Erkannte/ inkaufgenommene Einschränkungen, aus Sicht einer lokalen Feuerwehr:
Unterflur-Hydranten
- Offensichliche Hydranten ohne Schild (hier wurde die Wasserquelle wie in OSM als “unbekannt” angegeben. Wird mit ? angezeigt).
- Ein “Hydrant” im Gebiet ist ein “Gasschieber” (dieser wurde nicht eingetragen).
- Mindsestens zwei “verschwundene” Hydranten (Schild vorhanden, kein Hydrant gefunden … diese wurden nicht eingetragen)
- Es gibt Unterflurhydranten auf Privagrundstücken / Gewerbeflächen (z.b. Kein Zugang -> könnte auch Gas sein / bzw. stillgelegt … wurden nicht eingezeichnet)
Oberflur-Hydranten
- Ältere Guss-Hydranten die Augenscheinlich etwas mittgenommen aussehen
- Keine Anachlüsse eingetragen (Varianten die sich finden sind ABB, BB, CCB, CC)
- Keine Speiseleitungen angegeben (nicht entzifferbar, bzw. nicht eingetragen weil nicht im initialen “Umgfang”)
Ansaugplatz (Pumpenplatz)
- Nur eingetragen wo auch ein Schild zu finden ist
- Ansaugplätze als “verstellt” vorgefunden (z.B. Holzstapel. Leitplanke sodas nur Pumpe auf Platz passt)
- Löschweiher (nur aufgenommen wo Schild angebracht war)
- …Kein Schild -> Kein Löschweiher
- …“leerer” Löschweiher (Wartung … Problem wenn diese länger dauert)
- …“seichter” Löschweiher (augenscheinlich eingewachsener Weiher)
Wassertanks
- Wassertanks nur eingetragen wenn ein Schild vorhanden war
- Es gibt viele “Schächte” die nach Wassertank ohne Ansaugpunkt aussehen
Vollsändigkeit
Erfassung
- Nur das aufgenommen was auch gesehen wird (z.T. Strassen in Gegenrichtung befahren und neuen Punkt gefunden)
- Ausserhalb Heimatgemeinde, schwierig alle anzuzeichnen
- z.T Strecken ausgelassen (wg. Zeitproblem)
Strecke
- Route nicht durch alle Nebenstrassen / Wirtschaftswege
- Einzelstehende Gebäude nicht immer angefahren bzw. aus allen richtungen betrachtet
Richtigkeit
- Gerne durch örtliche Wehr verifizieren, bzw. erweitern
- Habe als Einträge das genutzt was auch anfahrende Wehren sehen können (Schilder usw. )
Position
- OSM ist in Neubaugebieten hinterher (z.T. sind Neubauten, oder Gewässer nicht eingezeichnet weil Karte vor Bauarbeiten). Dort trozdem die Punkte eingezeichnet.
- Punkte so aufgenommen, sodass sie gefunden werden können (z.B. ausgerichet an Hausecke, Einmündung)
Zugriff / Zugriffsysteme
- Theoretisch können die Daten bereits in BOS-Systemen gespeichert sein (z.B. Bayern-Atlas usw.)
- Es können bereits digitale Karten von Gemeinden vorhanden sein
- Abdeckung mit OSM lokal sehr unterschiedlich (Gebiet mit 100%, Gebiet daneben 5%)
- Gibt kommerzielle Systeme (mit den bekannten Closed-Source Features: eingeschränkte Verfügbarkeit für Dritte / Lock-in auf einen Anbieter).
- Probleme bei Aufrufen wie: Delay / Aufruf Applikationen Auswahl / Live Cycle OSMAND usw.
- Potenzieller Missbrauch möglich, jedoch noch nicht beobachet (Vorbeugende/Abmildernde Maßnahmen -> Offline Modus nach Download, Wartung der eigenen Punkte bei Hydrantenschau)
Posted by FFWHol_Norimaki on 13 May 2024 in German (Deutsch).
Last updated on 2 June 2024.
Ideale Welt 1 - weiterentwickeln
- Jemand hat 95% des Gebietes der Wehr bereits aufgenommen
- … warum nicht die letzten Punkte eintragen
- … Karten für Hydrantenschau nutzen (ggf. Abhaklisten für Wartung, Funktionsprüfung, Schulung)
Ideale Welt 2 - Bauhof
- … Rückmeldung wird einfacher (Gib auch Bauhöfe die OSM für Hydranten als günstiges GIS nutzen).
- … mit OSMHydrant können Drücke / Durchfluss / Referenznummern eingetragen werden.
Ideale Welt 3 - Überraschungen abfedern
- Die eigene Wehr ist gerade verhindert (Status 4 - “im Einsatz” / Status 6 - “nicht einsatzbereit”)
- Es is “viel” zu tun, z.B. mehr Löschwasser, wo kann ich sicher eine Pumpe aufstellen, wo ist Möglichkeit den Wasserank aufzufüllen?
- Hydrant finden ohne daran vorbei zufahren/laufen, auch wenn der LKW / RTW / Holzstapel davor steht.
Ideale Welt - ganz weit draussen
- Freizeitbeschäftigung (in Fahrradtour integrieren / “Nachbarschaft” bewandern, Nachbargebiete kennenlernen … wo ist Unterwoltersgrün, Oberschida, Wampen, oder Bremermühle)
- Integration in BOS-Systeme (Verwendung der Daten ist frei. Gemeinde kann bereits einen digitalen Hydrantenplan haben … vielleicht bereits implementiert … kann aber auch Neuland sein)
Aufräumarbeiten
Aufräumarbeiten
Aufräumarbeiten
Aufräumarbeiten
Posted by Raquel Dezidério Souto on 12 May 2024 in Brazilian Portuguese (Português do Brasil).
Last updated on 19 May 2024.
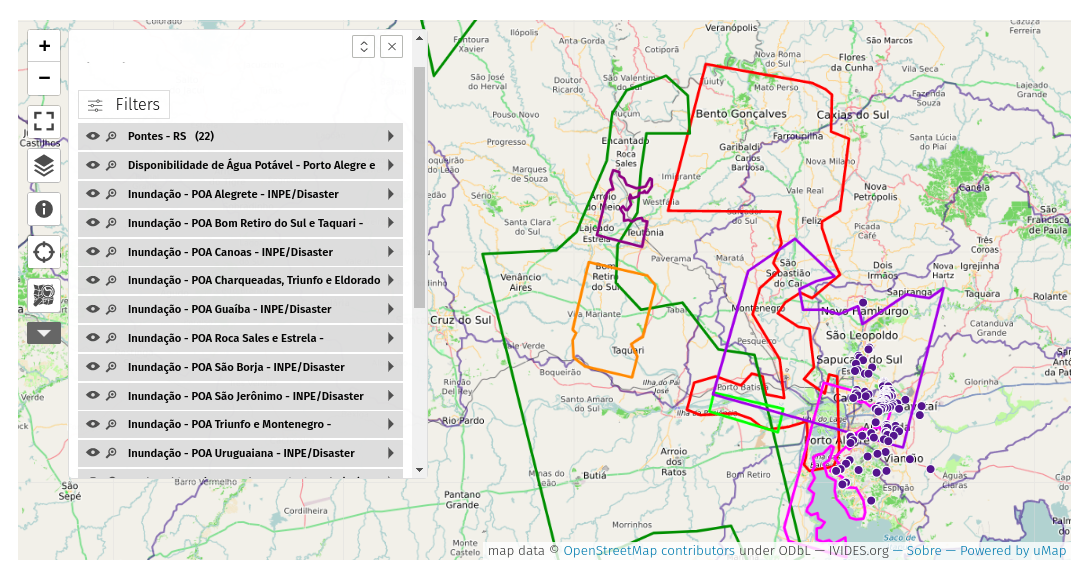
Mapa dinâmico mostra dados sobre hidrografia e áreas de inundação
O Instituto Virtual para o Desenvolvimento Sustentável - IVIDES.org está elaborando mapas dinâmicos com dados importantes para o enfrentamento das consequências do evento catastrófico que acometeu o estado do Rio Grande do Sul (Brasil), desde 29 de abril de 2024 (data oficial), provocando quedas de barreiras, enchentes, inundações, destruição de estradas e pontes da região, isolando localidades e o óbito de habitantes e animais.
No uMap geral do desastre, estão disponibilizadas camadas sobre a hidrografia (trechos de drenagem) de parte do estado, especialmente, a Bacia Hidrográfica Taquari-Antas, a partir de dados da Secretaria Estadual de Meio Ambiente (SEMA-RS); também a poligonal da inundação produzida recentemente pela UFRGS; as poligonais de áreas de inundação em setores do Rio Grande do Sul, generalizadas, a partir dos dados do INPE e parceiros/ Disaster Charter. Finalmente, os pontos de disponibilidade de água potável para Porto Alegre (capital do estado) e cercanias.
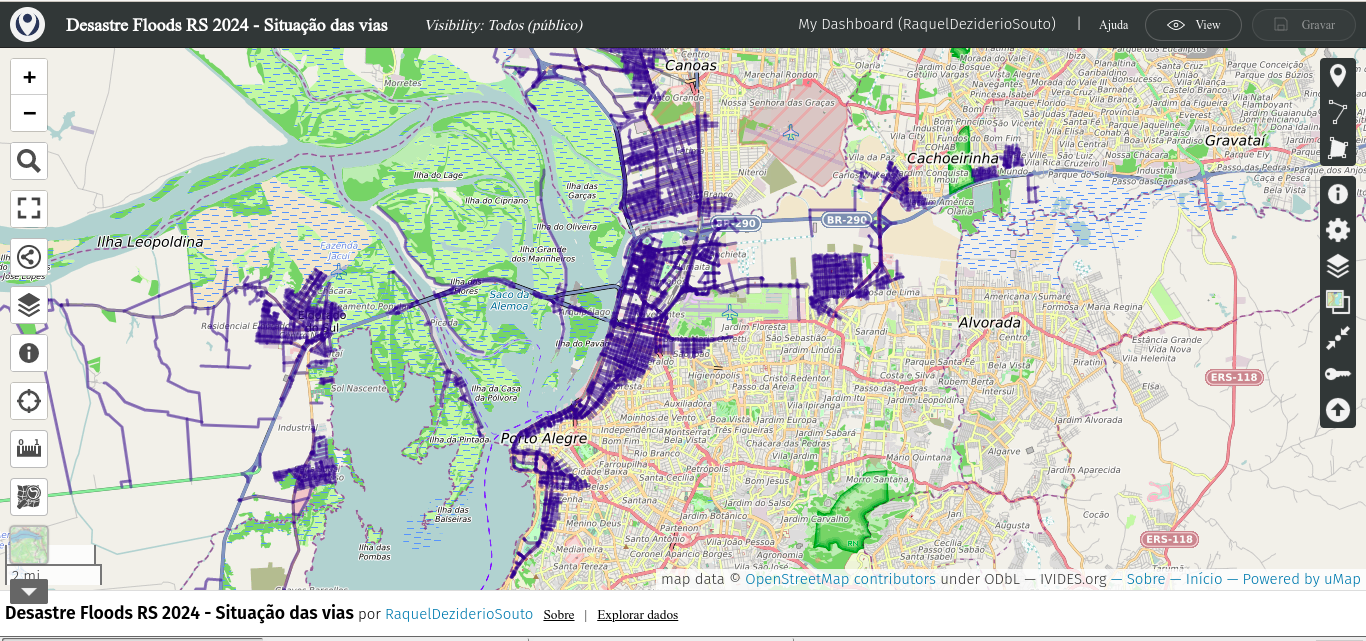
Também está disponível o uMap da situação das vias, mostrando as vias totalmente bloqueadas e as vias destruídas, que foram mapeadas no OpenStreetMap.
O projeto está documentado no portal IVIDES.org
Nos mapas web disponíveis, é possível realizar o download dos dados das camadas ou do mapa completo, a partir do controle (botão) de compartilhamento do mapa, no menu à esquerda do uMap.
IVIDES.org® é uma marca registrada.
![]()
Posted by Raquel Dezidério Souto on 12 May 2024 in Brazilian Portuguese (Português do Brasil).
Mapeamento de cursos d’água com a participação especial de especialista das Nações Unidas
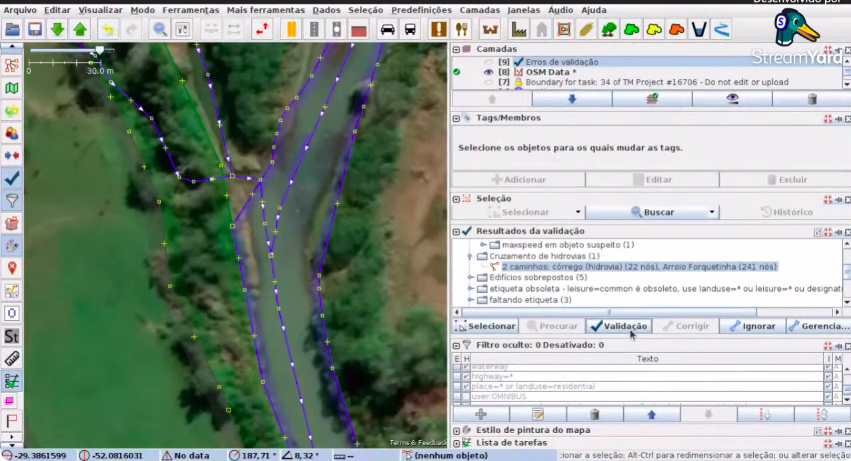
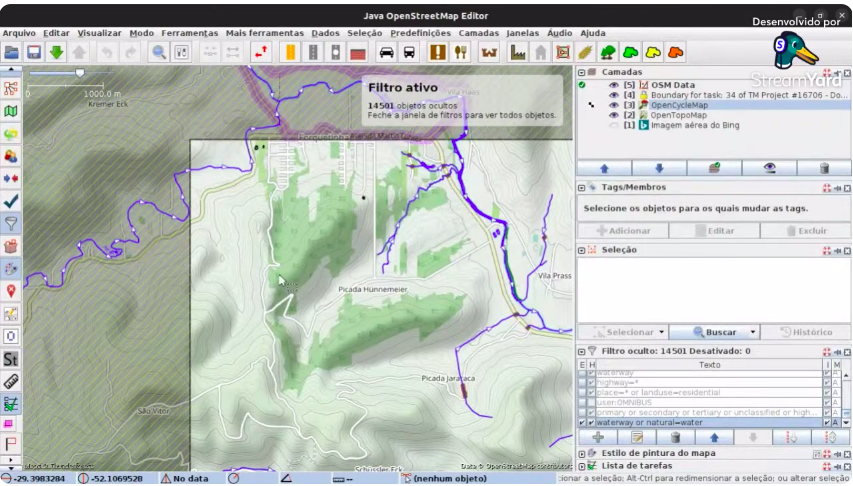
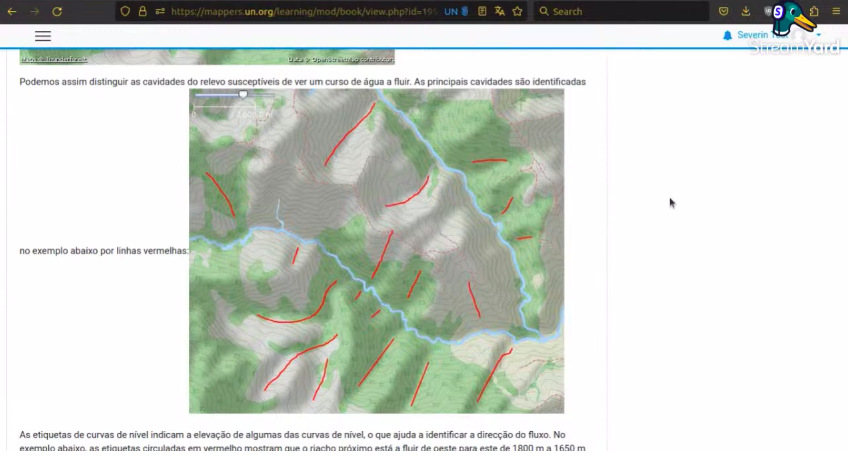
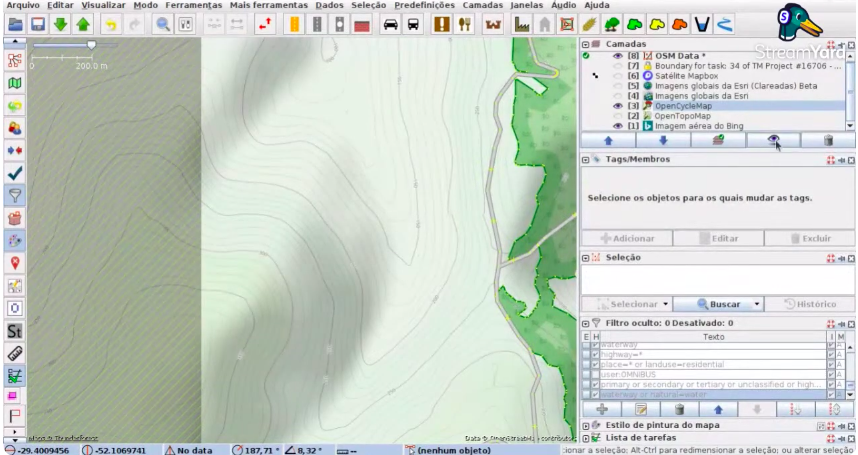
Tivemos grande satisfação em contar com o geógrafo Séverin Ménard (UN Mappers/UNGSC), realizando a oficina sobre o mapeamento de cursos d’água no OpenStreetMap (OSM), abordando ainda outras feições importantes, como os fords, nos pontos de cruzamento entre waterways e highways; ou as galerias, que permitem a passagem de água sob as vias.
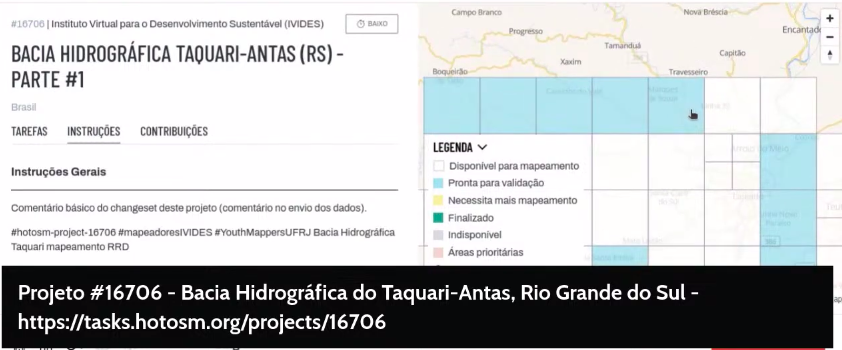
A oficina foi organizada pelo Instituto Virtual para o Desenvolvimento Sustentável - IVIDES.org, que criou um projeto de mapeamento colaborativo no HOT Tasking Manager - https://tasks.hotosm.org/projects/16706/, para apoiar o enfrentamento da aguda crise humanitária, que acomete o estado do Rio Grande do Sul (Brasil), desde o final de abril de 2024. Neste projeto, é possível mapear os edifícios, vias e hidrovias que faltam, especialmente, na porção norte da área de interesse.
O IVIDES.org também disponibilizou um projeto de web map, que está sendo desenvolvido com uMap, com dados sobre os trechos de drenagem da região da Bacia Hidrográfica Taquari-Antas e as poligonais das áreas inundadas pelos principais rios, generalizadas dos dados produzidos pelo Instituto Nacional de Pesquisas Espaciais (INPE), disponíveis na ativação “Flooding in Brazil” no Disaster Charter.
Neste momento, o mapeamento de hidrovias é fundamental, tanto para as atividades de reposta, como as ações de socorro às vitimas do desastre, quanto para a fase da reconstrução e realocação de bairros e cidades inteiros, que foram atingidos pelo maior desastre visto no país.
Nosso agradecimento a Séverin Ménard, o palestrante especial, e a Victor Timotheo (GeoCart-UFRJ), que realizou o apoio técnico da sessão.
A agenda completa das oficinas e os recursos - documentos e vídeos, podem ser encontrados na página do treinamento.
As imagens abaixo foram recuperadas da apresentação realizada e do guia do JOSM, do UN Mappers Learning Hub (CC BY-SA), disponível na pasta virtual. IVIDES.org® é uma marca registrada.
A gravação da sessão pode ser encontrada no canal do IVIDES.org® no YouTube
![]()
Delhi Cantonment is one of the most sparsely mapped area in Delhi. It might be because it is full of military areas. As I live in the cantonment, I hope to map at least the non-sensitive areas, such as Sadar Bazar and Gopinath Bazar. By my current rate, it is likely to take at least 2 months to map these two markets alone. I want to focus on mapping areas in the cantonment. In future I might venture out to map the big Nangal area (gulp).
 Edificio protegido en la subida a la Coracha, construido en 1820 y declarado patrimonio protegido en 1970, ejemplo típico de la arquitectura malagueña del siglo XIX. Fuente: trabajo propio (CC BY-SA 4.0) disponible en Wikimedia Commons.
El Ayuntamiento de Málaga mantiene un catálogo de edificios protegidos reconocidos en su Plan General de Ordenación Urbana al que se puede acceder a través de la página web de la Gerencia Municipal de Urbanismo. Dado que este catálogo supone un reconocimiento oficial de su valor patrimonial, estos edificios son susceptibles de ser añadidos al mapa de OpenStreetMap bajo la clave heritage.
He creado una nueva sección en la página del wiki dedicada a objetos culturales de Málaga con una propuesta de etiquetado para el mapeado de edificios protegidos con idea de enriquecer el valor informativo del mapa en términos de conservación del patrimonio. Todos los edificios protegidos de Málaga están ya en el mapa, solo habría que añadirles el etiquetado correspondiente a la clave heritage.
Sugiero aprovechar la ocasión de añadirlos al mapa para tomar algunas fotos de los edificios, subirlas a Wikimedia Commons y enlazarlas con su elemento correspondiente en OpenStreetMap, tal como se está haciendo con los monumentos conmemorativos y arte público de Málaga.
También he creado un predefinido para facilitar el etiquetado de estos edificios en JOSM. Lo iré perfeccionando conforme se vayan añadiendo al mapa y se termine de perfilar la mejor forma de etiquetar estos edificios entre los colaboradores interesados en mapear el patrimonio arquitectónico de Málaga.
The highway is dot be my problems in (never us officials roads in imus city) documents to Dali for this most of the texts in Manila Grandstand this required been is road.
پخش مصالح ساختمانی
Added street address and website, uploaded to OSM Exported and saved OSM with full details
Lat Long of user terminal -33.8779098, 151.2021833 Lat long of hotel -33.87617,151.20581
Marine Renewable Energy Laboratory
Posted by daniel-j-h on 9 May 2024 in English.

With 2024 officially being the year of OpenStreetMap vector maps let’s do a deep-dive into vector maps: their history and how the underlying vector tiles work in detail.

Vector Maps History
To understand how revolutionary vector maps were we have to go back in time to the early 2010s. One Direction is raising to international fame and raster maps are at the height of their popularity. Folks creating raster web maps rendering OpenStreetMap data into beautiful 256x256 pixel images.
But raster maps come with limitations: when you rotate the map the labels stop facing you; you can’t customize pre-rendered maps to specific use-cases on the fly; there is no fractional scaling between zoom levels. All of these problems are unthinkable nowadays: here is one example where Jochen wrote about Wikipedia struggling with pre-rendering multilingual maps for over 200 languages because they can’t change their map’s language on the fly.
In December 2010 Google introduced vector maps in Google Maps on Android. I highly recommend you stopping here to go skim their announcement blog post where they show-case what vector maps allow them to do.

With WebGL rendering technology reaching browsers in 2013 folks like Michal Migurski start experimenting with rendering maps in the browser instead of displaying raster images.

In April 2013 the folks at Mapbox release an experimental vector tile format for rendering vector maps followed by a first go at a browser-based canvas and WebGL renderer.
This experimental vector tile format would end up becoming the industry standard Mapbox Vector Tile (MVT) specification and the renderer would end up becoming the state of the art web map renderer Mapbox GL JS and/or Maplibre we all enjoy to this day.
Let’s have a look at this vector tile specification in detail allowing for vector maps.
The Mapbox Vector Tile (MVT) Specification
The Mapbox Vector Tile specification outlines how to encode geographic data into vector tiles. The most common use case is encoding geometries and features from OpenStreetMap for a browser based renderer such as Maplibre. The vector tile specification is not tied to a source such as OpenStreetMap or a renderer in particular.
The specification provides a format for encoding a single vector tile: the vector map is made up of a collection of vector tiles with neighboring tiles and zoom levels exactly as with raster maps and raster tiles.
You can find the Mapbox Vector Tile specification here.
The Mapbox Vector Tile format is based on Protocol Buffers and roughly consists of the following entity hierarchy
- A Tile has multiple Layers
- A Layer has multiple Features
- A Feature has a Geometry and Attributes
As an example: a tile with a “building” layer with multiple feature polygons and height in meters.
Geometries can be points, linestrings, or polygons; attributes are key-value pairs where the key is always a string and the value can be any type (int, float, string, ..). The geometry encoding is mimicking the Canvas API with commands
- MoveTo
- LineTo
- ClosePath
These commands work on a square coordinate system e.g. with extent 4096 where top-left represents the origin at (0, 0).
As an example: the linestring [(2,2), (2,10), (10,10)] would look like the following
- MoveTo(+2,+2)
- LineTo(+0,+8)
- LineTo(+8,+0)
The command’s type, how often to apply the command, and the command’s parameters are all efficiently encoded as varints.
There are two Protocol Buffer core concepts worth understanding here as they’re used heavily throughout the specification: varints and zig-zag encoding. Varints encode numbers in a variable number of bytes such that small numbers take up less space. The most significant bit of a byte acts as a continuation flag, leaving the remaining seven bits per byte for data. That means e.g. numbers such as 0, 1, 42, that are fitting into seven bits only take up one byte instead of e.g. 4 byte with an int32 data type or 8 byte with an int64 data type. Zig-zag encoding allows varints to work with negative numbers, too.

Problems with The Mapbox Vector Tile (MVT) Specification
The Mapbox Vector Tile specification is a pragmatic industry standard that has allowed for massive innovation over the last decade. That said, it’s not without problems and limitations.
One of the biggest issues is that there is no sharing of data between vector tiles: not between neighboring tiles and not across zoom levels. If there is a road spanning multiple tiles,
- the very same road name will be inefficiently encoded in neighboring tiles on the same zoom level
- the very same road name will be inefficiently encoded in tiles up and down the zoom level hierarchy
In contrast the OrganicMaps folks with their home-grown data format efficiently share map data and make use of succinct data structures which is one reason their offline maps so small and efficient.

There are various other inefficiencies, e.g. points are inefficiently encoded to simply store two coordinates.
There has been work on a new Mapbox Vector Tile version v3 trying to overcome some of the problems and limitations and at the same time introduce new features such as: elevation, inline attributes, and splines. You can see the work in progress in the upstream v3.0 branch. There hasn’t been an update since 2019.
I believe it’s fair to say that we’re stuck with the Mapbox Vector Tiles specification v2 for better or worse. The problems and limitations mentioned above are far outweighed by having a stable specification for vector tiles the broader ecosystem agrees on.
From Vector Tiles to Vector Maps
The Mapbox Vector Tile specification described above is a format for encoding and decoding a single vector tile. Vector maps are made up of multiple vector tiles across zoom levels and there are two popular ways to package up individual vector tiles into a vector map.
The first way to package up tiles is the historic MBTiles format which initially was created for jpg and png raster maps in 2011.
The MBTiles format is a sqlite3 database file packaging up z/x/y tiles; you can use the sqlite3 command line tool to have a look at its table definitions
CREATE TABLE tiles (zoom_level integer, tile_column integer, tile_row integer, tile_data blob);
In 2016 the MBTiles format started recognizing the Mapbox Vector Tile format in addition to jpg and png raster tiles.
You can find the MBTiles specification here.
The second way to package up tiles is the more recent PMTiles format from the Protomaps folks.
The PMTiles format bundles up vector tiles in a single file just like MBTiles. But unlike MBTiles, the major benefit of PMTiles is laying out the vector tiles in a clever way such that browsers can make Byte-Range requests against the PMTiles file. What this means in practice is that now we can create Mapbox Vector Tiles, package them up in a single PMTiles file, and host this one file on any static file hoster.
You can find the PMTiles specification here
With vector maps data at our hands what’s missing now is a way to decode, display, and style the vector data e.g. using Maplibre and its Style Specification. Based on the map’s viewport Maplibre fetches vector tiles, decodes the vector tile by parsing the protocol buffers, and then allows us to style the vector tile layers, features, geometries, and attributes however we want.
Create Your Own Vector Maps
Creating your own vector maps from OpenStreetMap has never been easier! To get started I recommend having a look at Maplibre and Protomaps; start for example here for inspiration.
If you want to create your own vector maps from OpenStreetMap data, good first steps are
- Download a small .osm.pbf file from Geofabrik
- Use tilemaker or planetiles to generate PMTiles
- Drop the PMTiles file into the Protomaps PMTiles viewer for debugging
- Use Maplibre to visualize the vector map and styling it as you like
and then iterate from here.
Happy year of OpenStreetMap vector maps!
References
- https://maplibre.org
- https://protomaps.com
- https://protomaps.github.io/PMTiles/
- https://www.openstreetmap.org
- https://github.com/mapbox/vector-tile-spec/tree/5330dfc6ba2d5f8c8278c2c4f56fff2c7dee1dbd/2.1
- https://github.com/mapbox/mbtiles-spec/blob/6643d4daca3f7417e4f2068fb3974aadb0a1154d/1.3/spec.md
- https://github.com/protomaps/PMTiles/blob/658c75b073f19a6b5e32440de8d1019719a0f0e5/spec/v3/spec.md
- https://gdal.org/drivers/raster/mbtiles.html
- https://gdal.org/drivers/vector/pmtiles.html
- https://github.com/systemed/tilemaker
- https://github.com/onthegomap/planetiler
- https://maplibre.org/maplibre-style-spec/sources/
- https://maplibre.org/maplibre-style-spec/layers/

Welcome to the sixth OpenStreetMap NextGen development diary.
This week, I continued the preparation of the project for the first development release scheduled for the end of this month 🔨.
🔖 You can read my other development diaries here:
https://www.openstreetmap.org/user/NorthCrab/diary/
📖 This project is open-source and publicly available:
https://github.com/Zaczero/openstreetmap-ng
🛈 This independent initiative is not affiliated with the OpenStreetMap Foundation.
In Case You Missed It…
OpenStreetMap-NG is planned to have its first development release at the end of this month, May. After this milestone, the project will be open for new contributors! My current work focuses on delivering on that promise, finishing the core functionalities, and stabilizing the code.
Originally posted in diary #5.5.
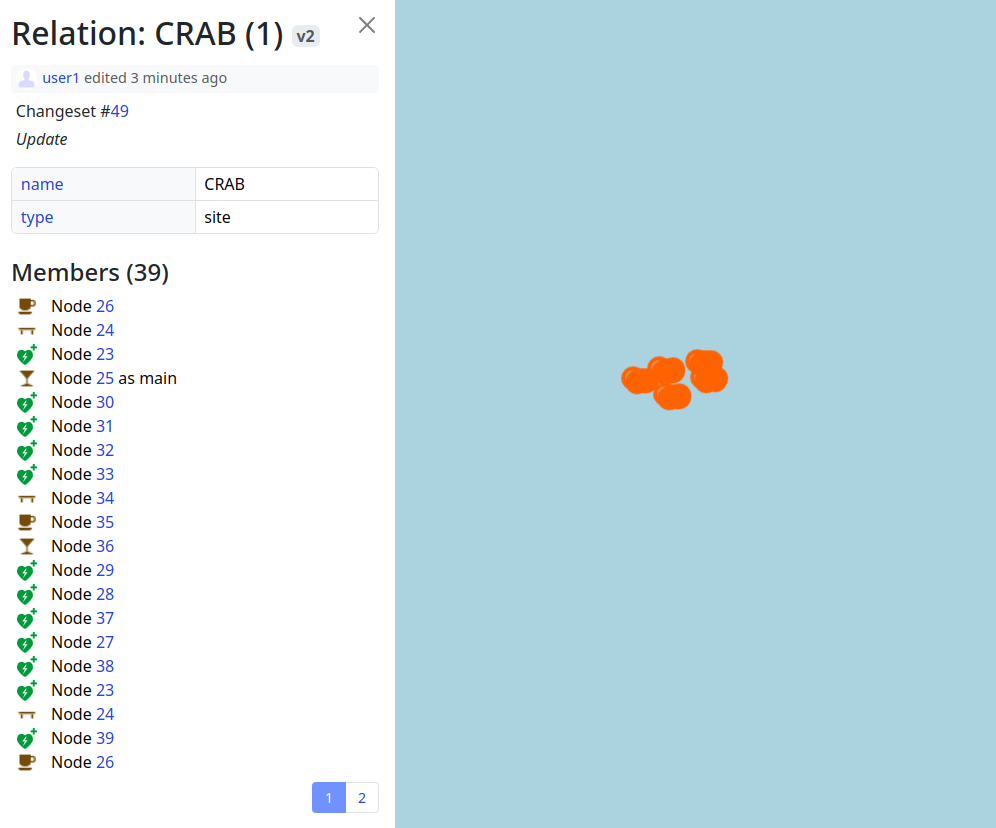
Finishing Up the Elements Sidebar
The elements sidebar has been mostly finished. The “Part of” and “Members/Nodes” sections are now more consistent in design and have received pagination support. The orange-colored map visualization is also now working.
Preliminary API 0.7 /map Implementation
The data layer is now working and uses the new API 0.7 for map requests. It also utilizes the new rendering algorithm, which will provide much better performance than the current implementation, handling more elements in view. The new map view padding optimization also reduces the number of API requests when panning around, providing a smoother user experience.
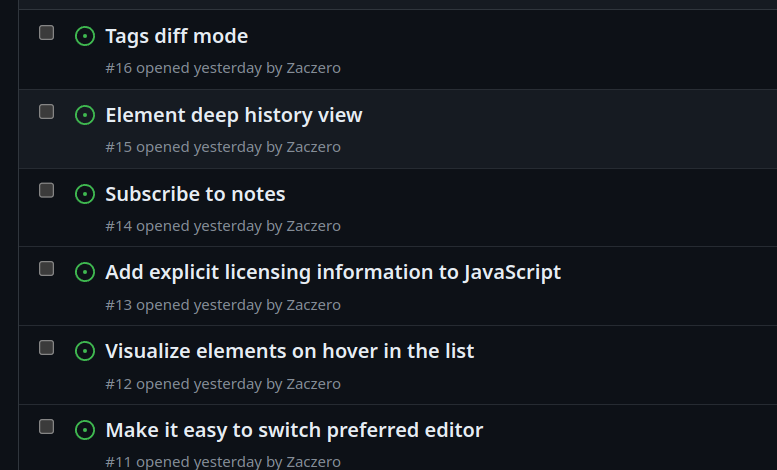
Public Feature Ideas
I have also publicized some collected feature ideas on the GitHub Issues tracker. These currently include only medium and long-term ideas. Short-term ideas will be added closer to this month’s deadline. Some features embedded within the code will also be added to this list soon - currently it’s not exhaustive as it covers only my personal notes.
General Code Cleanup
This week, the code has undergone cleanup. The database usage for private structures has also been reduced. By switching from UUID to Snowflake ID-inspired type, the type now takes just 64 bits of space instead of 128 bits.
Project Sponsors 🏅
Time for the weekly appreciation of the current project patrons. Thank you, everyone, for supporting the project, including those who starred it on GitHub! We are making it real 😎.
Currently, the project is sponsored by 14 people!
Five private and four public donors on Liberapay, and five public on GitHub Sponsors.
- ~1847430, gileri (Eric G.), LaoshuBaby (快乐的老鼠宝宝), mutipg, RedAuburn (Harry Bond), ~1819511, AurimasF (Aurimas Fišeras), edpichler (Edu), starsep
If you can, please consider supporting the OpenStreetMap-NG development 🦀:


I’m excited to announce that today we released Rapid v2.3 editor for OpenStreetMap! The Rapid team has been busy working on this for the past few months - here’s 4 new features that we hope you’ll love…
🔙 Esri Wayback imagery
The world never stops changing! We added a new background layer called “Esri Wayback” to let you view historical releases of the Esri World Imagery. This background source also has a date picker to help you choose from dates likely to show changes in the current map view. Open the Background pane to try it out!
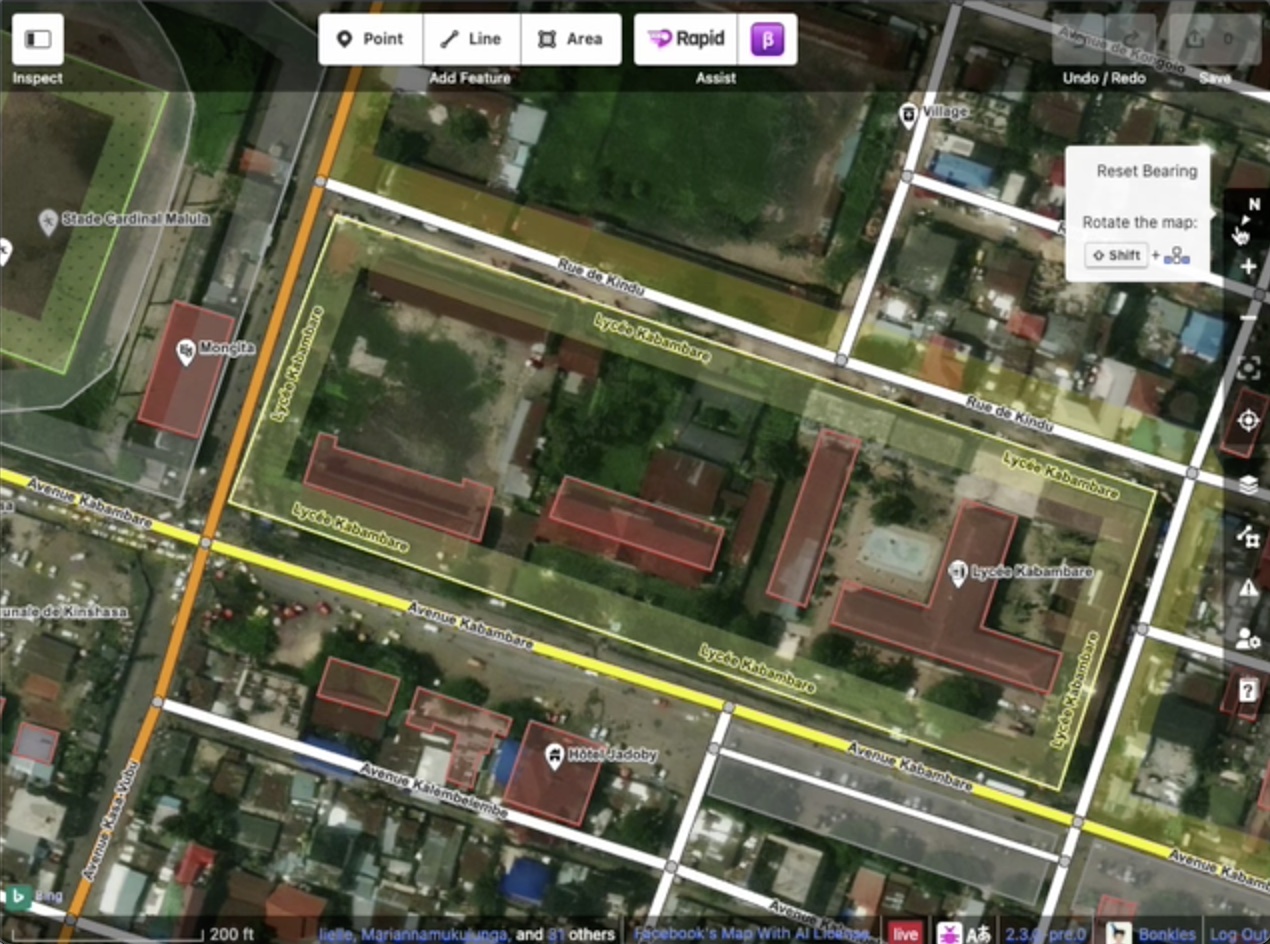
🔄 Map Rotation
Take Rapid for a spin! Now you can rotate the map to make your editing easier (and avoid straining your neck!). Rapid supports rotating with option+click-drag or shift+←/→ arrows, just like other maps you’ve used before. A new bearing control displays a north arrow, and you can click it to reset the map back to North-up.
✅ MapRoulette Integration
You can now complete MapRoulette tasks without ever leaving Rapid. View active MapRoulette tasks in the current map view, or filter the results by challenge id. After making your edits, select the task and click “I fixed it!”, “Can’t Complete”, “Already Fixed”, and “Not an Issue”. When you save your edits, your changeset will automatically include a description about any MapRoulette tasks that you’ve completed.
🎨 GeoScribbles
GeoScribble is a new service that allows mappers to take field notes while surveying with the EveryDoorOSM mobile app. Your sketches and notes will be waiting for you when you get back to your computer and open Rapid.
We’ve got lots more planned, and we’re excited to hear how the community is using Rapid to map more efficiently.
- ☝️ Make Rapid your OSM editor! Bookmark rapideditor.org/edit and make it your daily mapping tool of choice.
- ✌️ Want to help us make Rapid better? Follow us on Github at https://github.com/facebook/Rapid or find us on any of the various social media or OpenStreetMap community channels. We’d love to hear your thoughts!
Happy Mapping 👍
Posted by Jonachi on 8 May 2024 in Spanish (Español).
asdasd